Monitoring physical exertion
Frank Vandewiele
Issues
“During his time trial at the 2017 World Championships, Tom Dumolin saw extraordinary wattages on his bike computer, causing him to think his power meter was broken. However, he followed his instincts and became world champion.”
When training methodology was still in its infancy and there was no scientific approach, everything was based on experience and the evolution of that methodology was mainly based on guessing and missing. The extremely conservative cycling milieu has been an example of this for a long time, but in the last decade a true revolution has taken place, mainly because scientific knowledge has become much closer to daily training practice.
Trainers/coaches are now better educated, they have easy access to relevant information and - almost like university labs - they have access to highly specialized measuring and registration equipment. Easy-to-use yet high-performance software helps them process the resulting influx of data. Here's the positive story.
Without data, scientific research would indeed come to a standstill and also in the approach to our physical condition, the more data, the more precise the decisions will be. Or should we say “can” be? Can be indeed because there is something treacherous going on. After all, “Big Data” has become synonymous with “Big Insight”. We tend to consider only the measurable to be important and to leave the role of the coach and the athlete – the autonomous person who is able to think, interpret and, above all, make choices – out of the picture. As Einstein said: “Not everything that counts can be counted, and not everything that can be counted counts.
Monitoring
Nevertheless, effort monitoring is undoubtedly an essential part of the training methodology. Without it, the coach would not be able to verify that the programmed loads actually achieve their goal or estimate how "heavy" the different types of races are.
There are essentially two types of monitoring, external and internal. For cycling, the power meter is just about the most efficient tool for measuring external load but which tool is suitable for measuring internal load?
In the context of our enormous reliance on smart computers that help us calculate certain patterns from millions of data points and hundreds of variables, it may sound strange but in leading articles on training one can read that the Rating of Perceived Exertion (RPE) is still the most relevant way to estimate the severity of training and competition. The picture below indicates that there is some truth behind that claim after all. Maybe not with soccer players because they always look like they are dying but the grimace on the faces of these three riders in the photo below - as a visual expression of their RPE - undeniably indicates how strenuous their bodies perceive that exertion to be.

Here we see riders who, although delivering approximately the same external load, react to it in very different ways. If we would express this effort in the three classical effort zones, then
- the 2023 world champion rides in zone 1 or in the effort zone he can sustain for a long time.
- the man from Bahrain in zone 2. He is already showing clear signs of exertion that we could define as quite heavy.
- the Movistar rider in zone 3. He is just hanging on but it is clear that he will have to abandon such effort in no time.

Effort zones
Effort zones - no matter how they are created or on which parameter they are based - do add value to training methodology because they make us understand the need for different levels of training, but they do not in themselves guarantee training results nor are they able to accurately evaluate races. The interpretation of "training zones" must therefore be handled judiciously. Even if the delivered power perfectly matches the definition of that zone, it remains unclear to what extent the intended energetic system is loaded. To make a long story short, as long as, in addition to the intensity, the duration of the single effort, the characteristics of the rest periods and the totality of the effort are not taken into account, the degree of loading of the zone in question cannot be mapped. Thus, the "severity" of the competition or training or the expected adaptation of the different systems within the body will always be only approximately correct. "Time in zone", "Normalized Power", "FTP" and "Training Stress Score" were until recently good measures or reference values to monitor an effort but anno 2023 are no longer sufficient.
The Extended Critical Power model and the resulting Exhaustion – Recuperation model by C. Dauwe D.Sc. does meet the requirements of modern training and competition monitoring. On the one hand, because it falls back on the most exact form of external intensity measurement, and on the other hand, because via the widgets in the “SuperCycle” app it is possible to view the used percentage of VO2max, the balance of the anaerobic energy reserve and the load scores of the underlying energy mechanisms live on to follow.
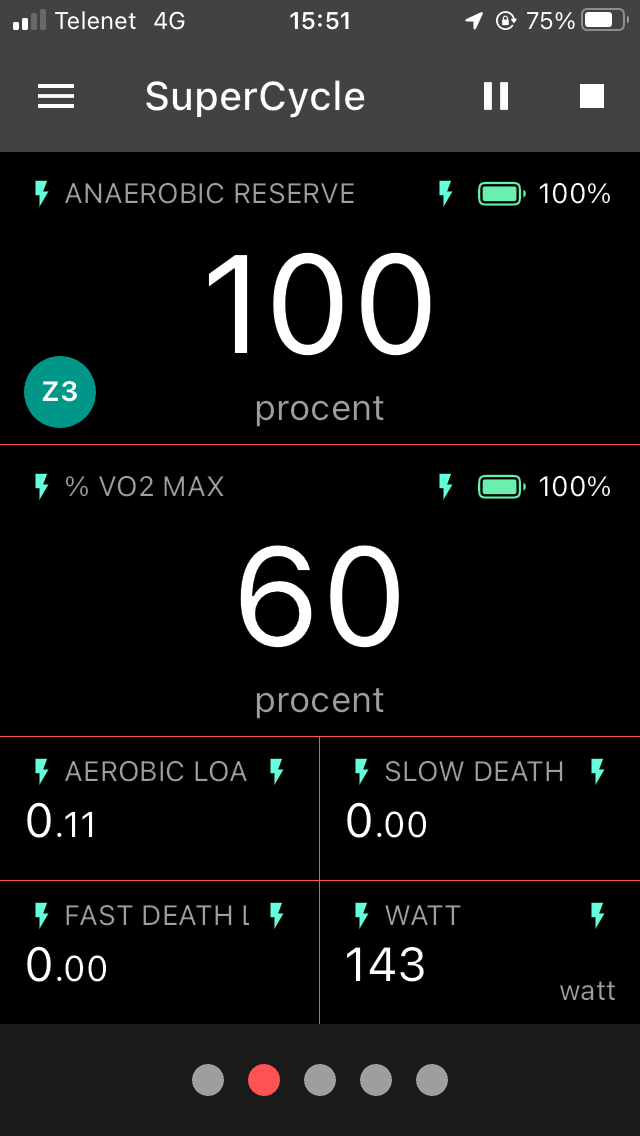
A snapshot of a Long Slow Distance training on (one of many possible screens) the app SuperCycle. It displays the following parameters "in the action":
· % anaerobic reserve
· % VO2max
· Power
· Aerobic Load, Slow Death Load and Fast Death Load of the total effort already expended.
When using this application, the snapshot of the image in question would look like this:
· a "battery" that is 99% charged while its effort is in zone 1 - to the above model in the purely "aerobic" zone.
· a battery still containing 25% of anaerobic energy while this rider is in zone 2 - the "slow death" zone.
· a battery that has only 11% of energy left and which, moreover, will drain very quickly since this rider is performing in zone 3, the "Fast Death" zone.

RPE and SuperCycle, the (almost) perfect marriage.
The RPE expressed on a scale of 10 or 20 is a subjective measure of value and is best linked to objective exercise parameters that can also be monitored "in the action”. In our opinion, the widgets in the SuperCycle application are best suited for this purpose.
A marriage between the two will allow the trainer to analyze the performance delivered via objective data in great detail and still take account of the athlete's own feelings.