A new training concept:
unprecedented precision and accuracy !
A training concept starts with an unambiguous determination of the rider's capabilities and knowledge of the requirements of the target race. We have made this possible with the development of the Extended Critical Power concept.
The cyclist and his coach can now rely on detailed metabolic profiles, valuable load indices, customized training zones and the live registration of the exhaustion and recuperation of the anaerobic energy reserve W’bal.
We can now also offer a unique solution for a coach's biggest challenge: putting together the perfect workout. No more guesswork and endless messing around to put together a suitable format for interval training.
Finally, the factors that cause the anaerobic energy reserve to replenish faster or slower during rest are complex and highly individual. IRI, the Individual Recovery Index should be considered the fixed reference value that reflects your personal recovery.
A new training methodology is therefore necessary and is part of our
“Training and Analysis Module”
First and foremost
we have added a table named "Sample Training Routines" containing, based on our 50 years of experience with cycling training, the most essential workouts to improve the VO2max. They are “basic” workouts.
Use them or use your own. In any case they must be fine-tuned according to the objective
and the capabilities of the cyclist.
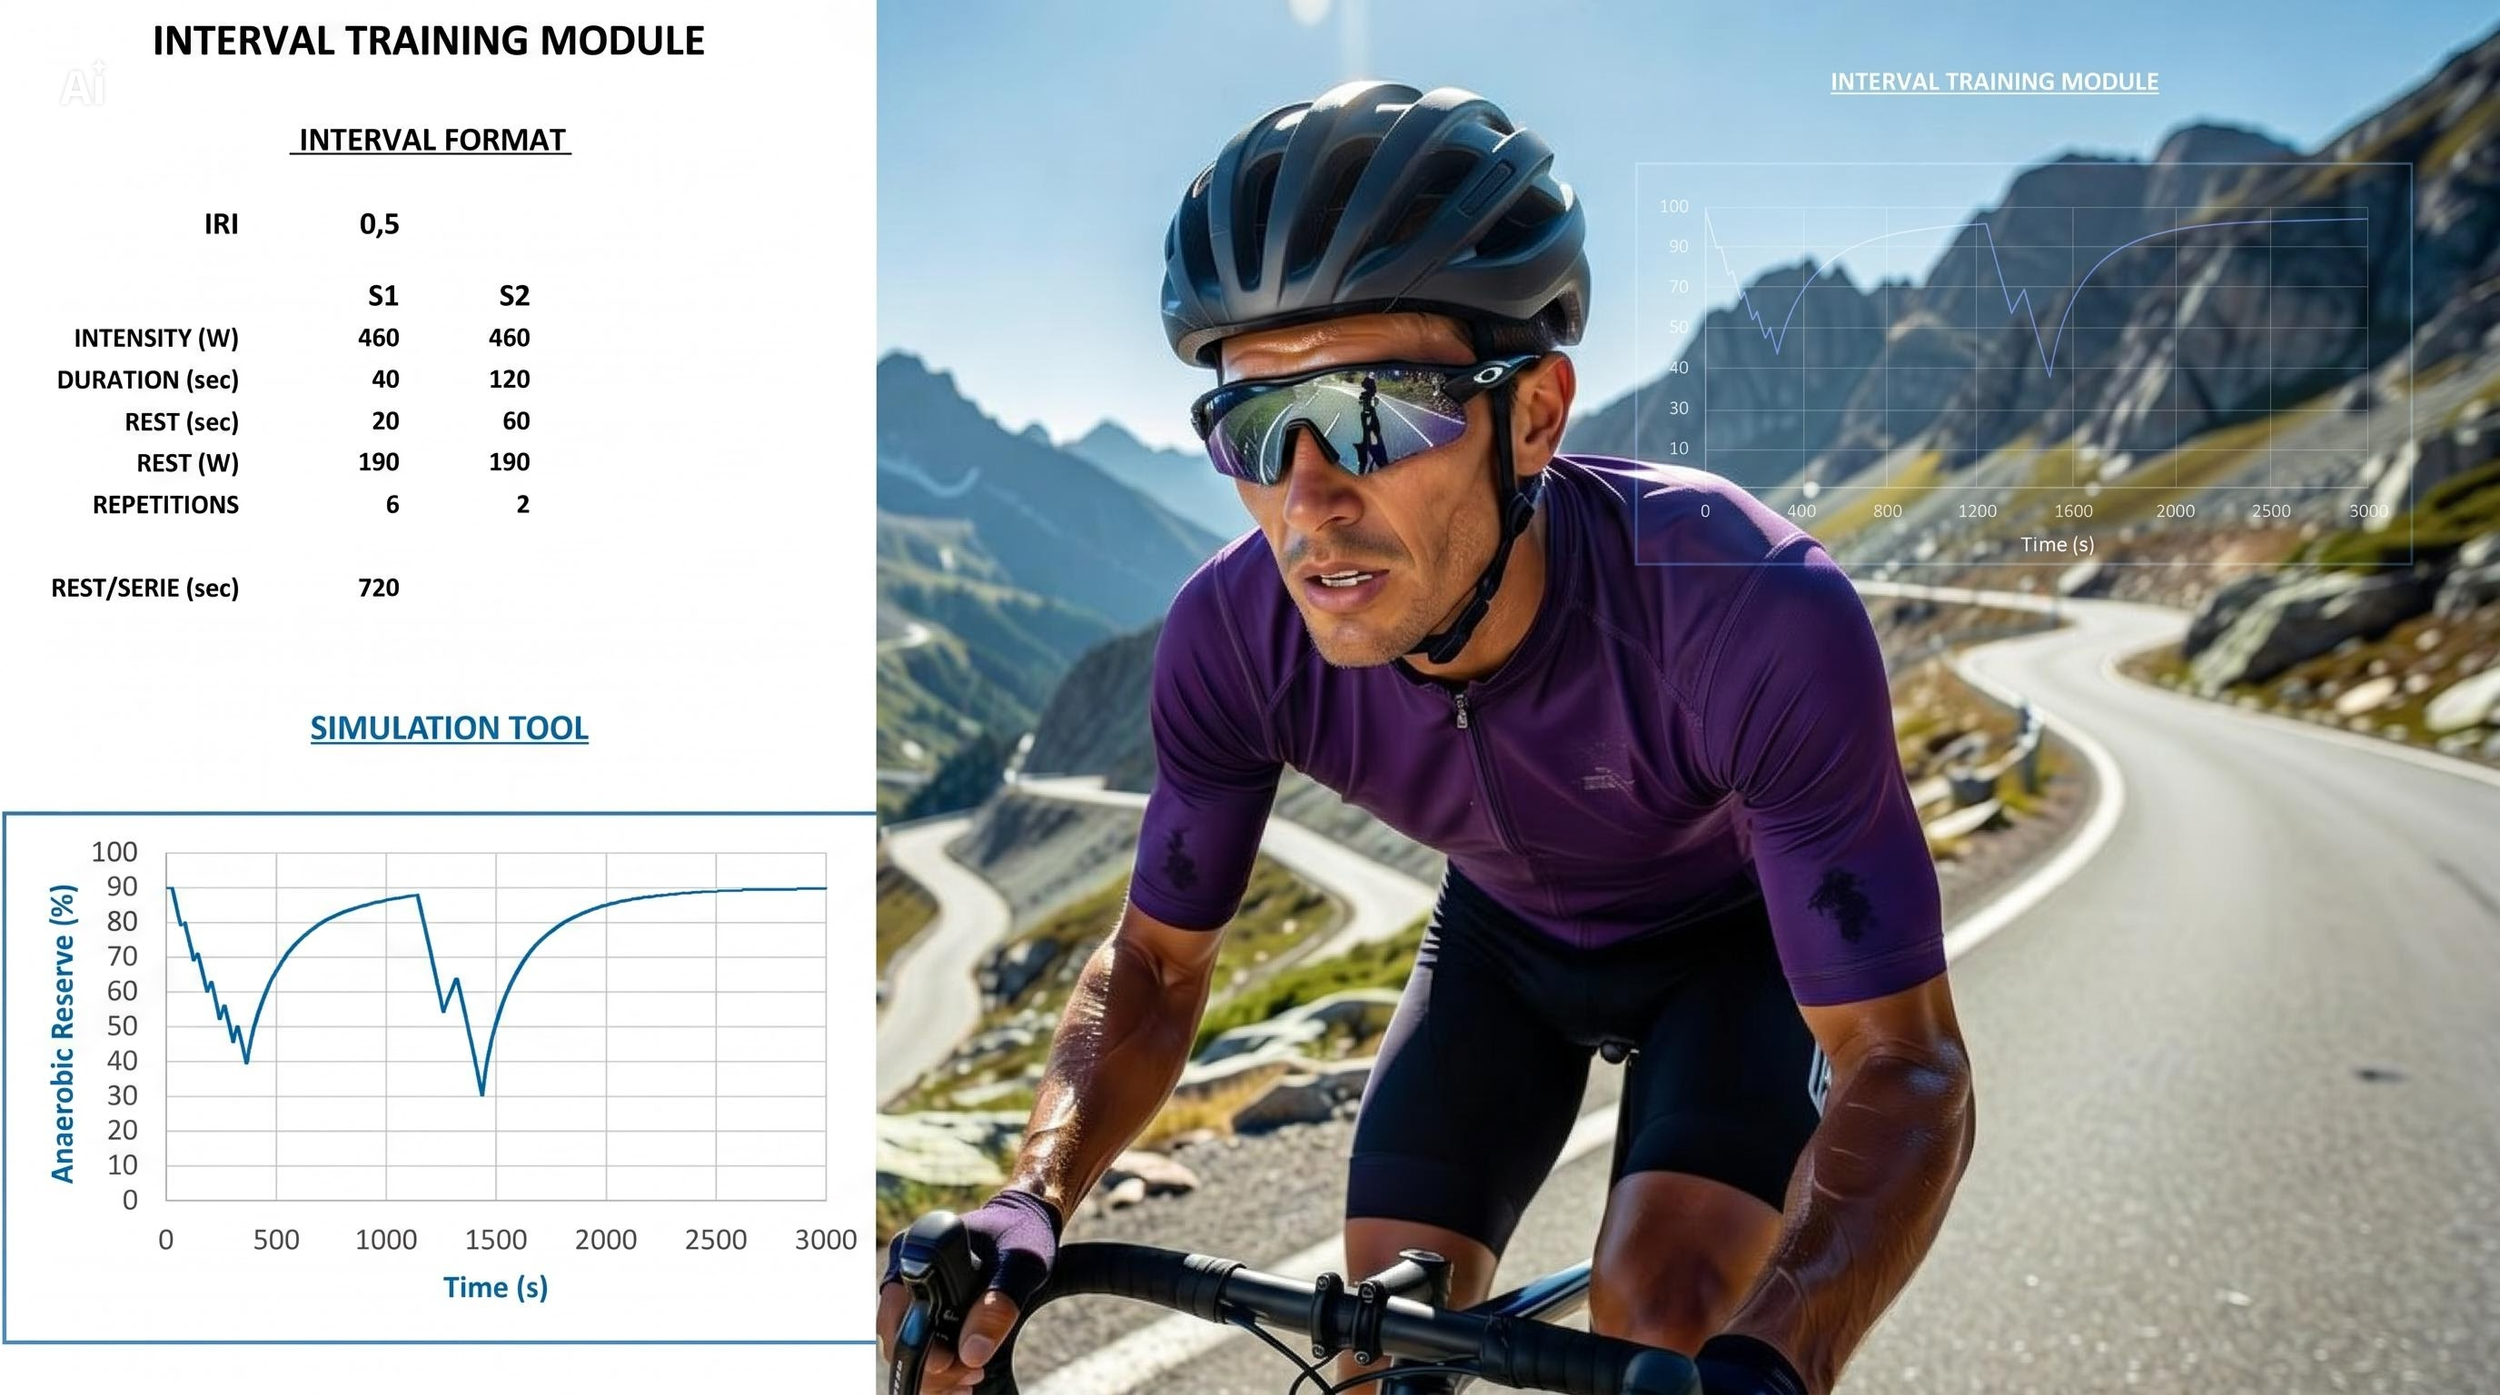
Following on from this, we developed the Interval Simulation Tool
This tool takes all of the above considerations into account and can safely be called unique in its kind.
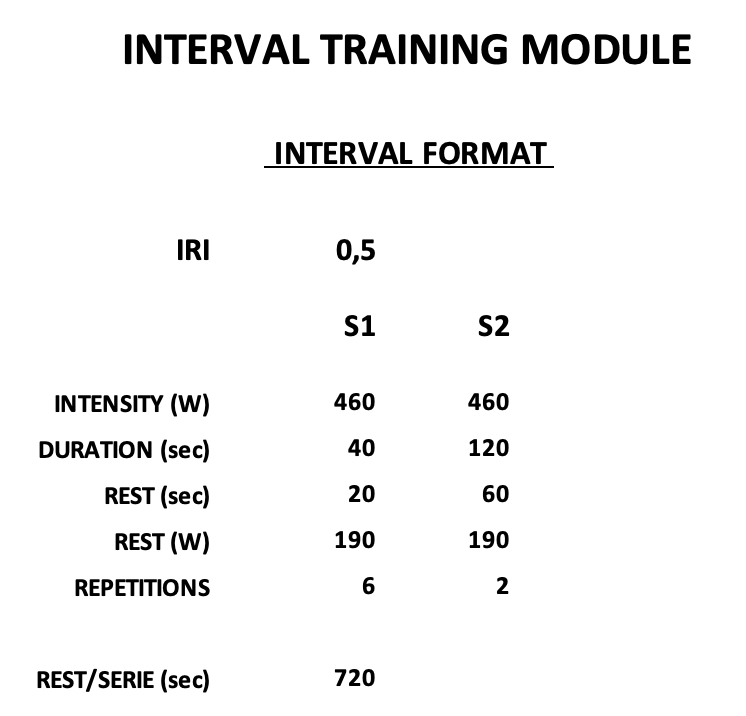
As soon as IRI, the intensity of the single effort (to be chosen by the user according to the goal), the duration of that effort, the intensity and duration of the recuperation period and the number of repetitions is entered, the tool creates a graph simulating the course of the exhaustion - recovery of your anaerobic energy reserve (W’bal)
for the chosen interval format.
The tool allows you to enter up to 2 series.
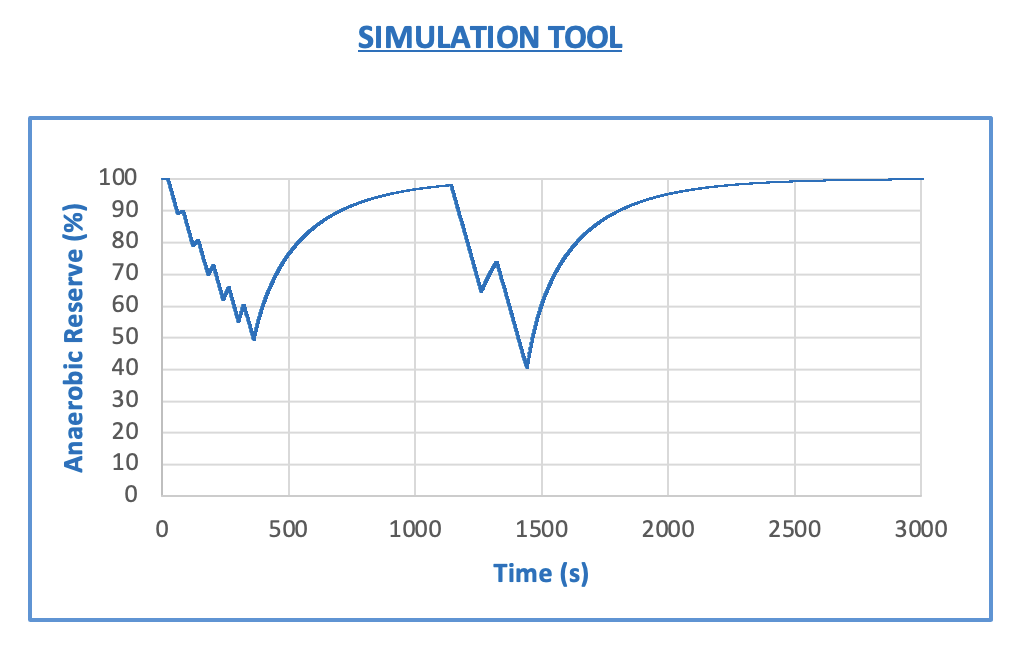
Notice the difference in exhaustion
even though the total duration of exercise
in the two sets is the same
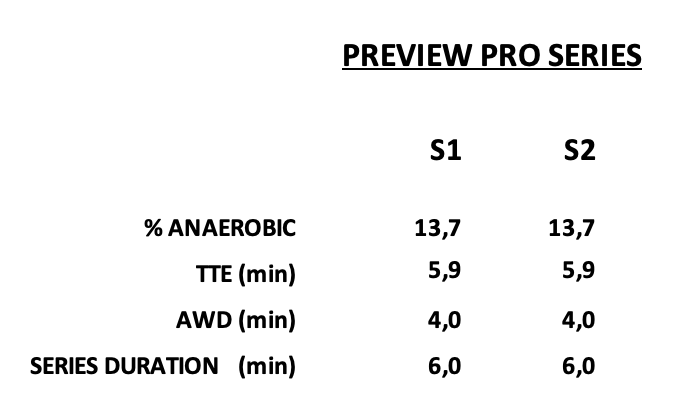
In the accompanying table, you can see the anaerobic contribution for the chosen intensity, as well as the difference in exercise time between endurance exercise (Time To Exhaustion) and interval exercise (Accumulated Work Duration).
Monitor your interval session
"in the action".
Since the anaerobic widget in the SuperCycle app allows the performance to be monitored
"in the action," it is possible
to control the format of an interval training via the anaerobic energy balance
and not via the classic exercise- and recovery duration.
This is particularly interesting for specific interval tasks as with the
High Intensity Decreasing Interval Training (HIDIT).
A decreasing interval training could look like this:
1° repetition: lower the balance up to 30 %
2° repetition: lower the balance up to 40 %
3° repetition: lower the balance up to 50 %
And all further efforts up to 60 %
After each effort, W' should be replenished to, say, 80 or … %.

This design ensures that oxygen supply remains at a high level without causing the anaerobic contribution to skyrocket. No perfect training session without the knowledge of
your individual metabolic profile
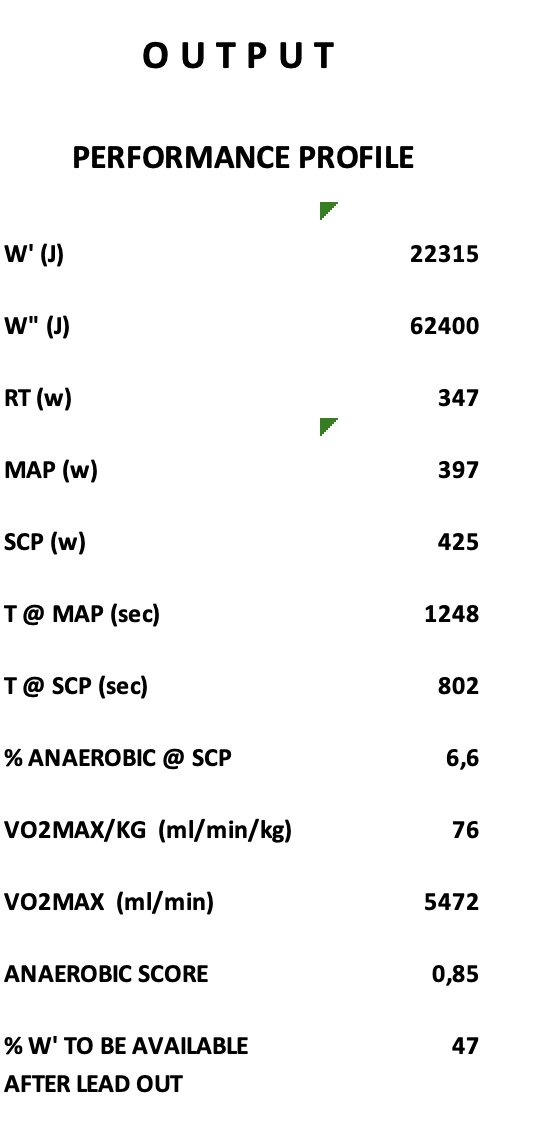
The training module therefore provides an input field from which those necessary data are calculated. It requires the 5 basic tests and, if required, additionally a sprint test and a 30" test. The sprint test is necessary to calculate the ideal lead-out, the 30" test to display the rate at which you use up your anaerobic capacity.
In other words your anaerobic power or your VLamax .
From the individual profile we can now compute training zones.
They represent the energy system that is dominant,
it does not mean that a certain zone exclusively uses this energy system!


The % VO2max widget for endurance training
SuperCycle features the % VO2max widget that allows the rider to monitor oxygen consumption in real time.
Please note: this is an averaging, so it assumes that the effort is constant!
Efforts below the Recovery Threshold are purely aerobic and are mostly performed as
endurance training in steady state conditions.
In this case the % VO2max widget is very useful.
Efforts in the SD zone, above RT but still below SCP, are usually performed as an interval session,
so it is not always easy to use the widget correctly.
However, we can generally accept that oxygen consumption in this zone fluctuates between 90% and 100%.
For the SD zone as well as for the FD zone it is more important to use the % anaerobic contribution to guide the training.